Get started
🌐 What Is TradingView? #

TradingView is the world’s most popular charting and financial analysis platform — and for good reason.
Accessible directly from your browser or mobile device, it lets you analyze any market in real time: Forex, indices, stocks, crypto… all in one place.
Whether you’re scalping or swing trading, TradingView offers a clean and intuitive interface, with powerful tools for technical analysis.
It’s the platform we chose to host all our indicators.
🧭 Why Use TradingView With ICTProTools? #
Our indicators are built exclusively for TradingView.
This means you can apply them to any chart and take full advantage of all TradingView’s features:
- Custom layouts and chart views
- Multi-timeframe analysis
- Real-time price alerts
- Mobile notifications
- Watchlists for your favorite pairs
- Full visual customization (including dark mode)
From desktop to mobile, you’ll always have access to your setups — wherever you are.
🔑 What You Need To Get Started #
To use ICTProTools indicators, you only need:
- A free TradingView account
- A stable internet connection
- Access to our tools (granted after purchase)
Once your access is active, our indicators will appear automatically in your TradingView account under “Invite-only scripts” — no download required.
📝 Creating a TradingView Account #
1. Go to tradingview.com
2. Click “Sign in” at the top right

3. Create your account using email or social login
It’s free — and takes less than a minute.

📊 Navigating TradingView Charts #
🔍 How To Open a Chart #
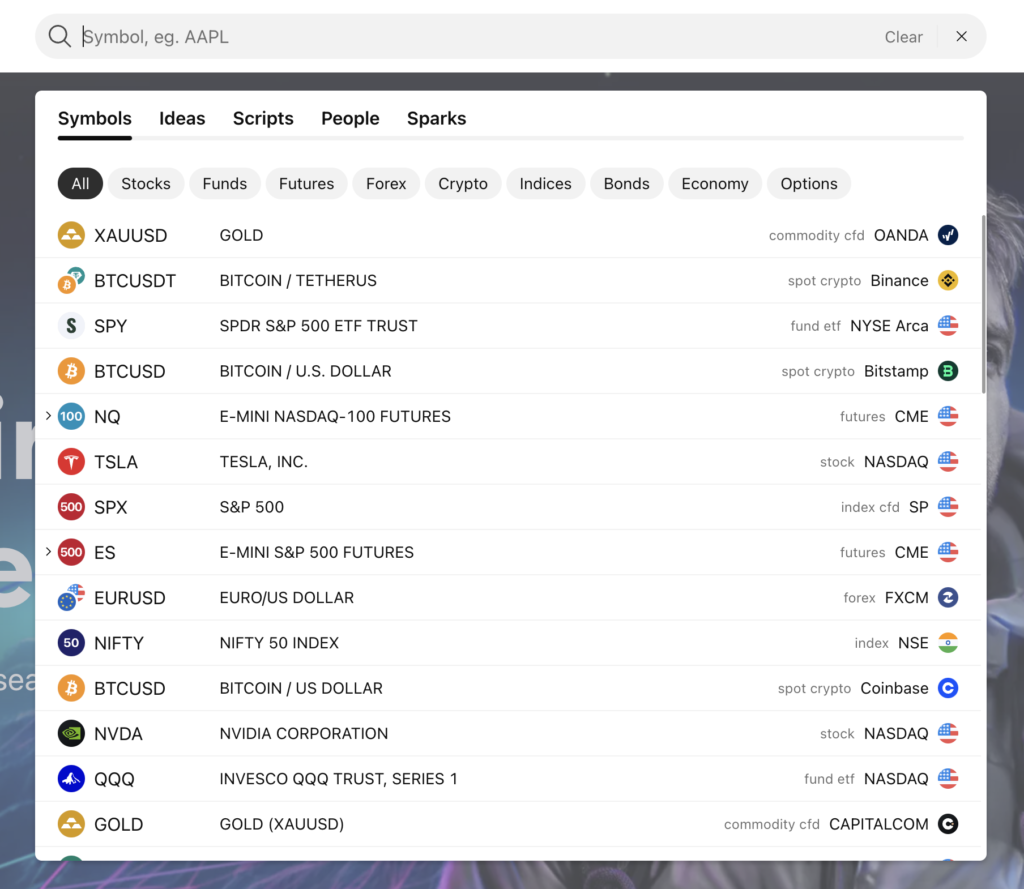
Once logged in, type a symbol in the search bar at the top of the homepage.
You’ll then be taken to the main chart window.

You can also click on “Products” → “Supercharts”.

📈 How To Change Symbol #
To switch assets, click on the current symbol name at the top left of the chart.

Or just type the name of the pair or ticker directly (e.g. EURUSD, US100).

⏱ How To Change Timeframe #
Click on the current timeframe (e.g. 1m, 15m, 1H) located next to the ticker.


You can also type the timeframe directly using your keyboard (e.g. 15 for 15 minutes).

➕ Add An Indicator To Your Chart #
Click on the Indicators button at the top of the chart.

Search for the indicator (e.g. ICT Breakers) and click to add it.

⚠️ Our Premium indicators will appear only after your access has been granted.
You’ll find them under the “Invite-only scripts” section.

💾 Save Your Chart Layout #
To save your layout, click on the Save indicator template icon at the top right.
This keeps your preferred indicators, chart settings, and timeframes ready for each session.

💡 Pro tip: When we update an indicator, your custom parameters might reset to default — saving your layout helps avoid losing your setup.
