ICT Insight™
🧪 Standard Deviation (STD) – Application with the Momentum Structure Indicator #
🎯 Purpose #
This module automatically detects a consolidation within the CBDR time range (1:00 PM – 11:00 PM NY time), then duplicates it to help you anticipate potential daily highs and lows.
The idea is simple:
Identify a real accumulation phase inside the CBDR → Project this zone → Define possible reaction levels.
💡 The indicator does not duplicate the time range, but rather a specific consolidation detected within that range (based on the selected timeframe).
✅ Step 1: Enable the STD Module #
In the Momentum Structure indicator settings:
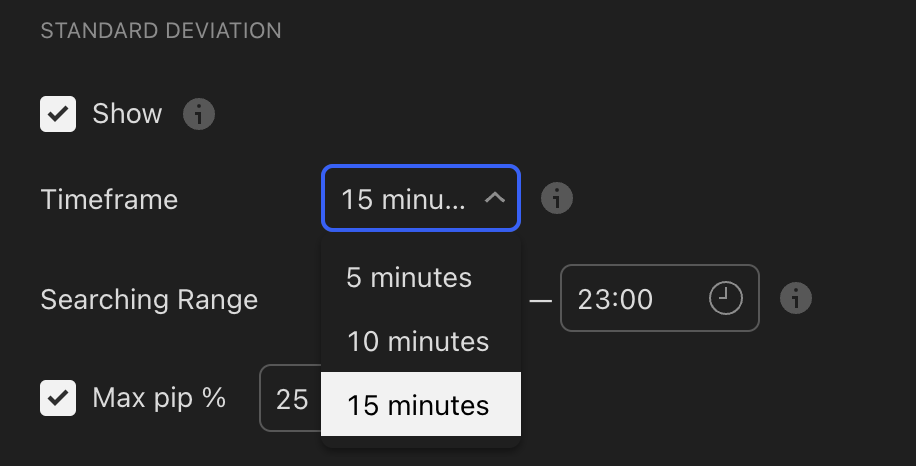
- Check “Show” to activate STD display
- Choose your analysis timeframe:
- 5 min
- 10 min
- 15 min (default)
⚠️ Important: the chart’s timeframe must be less than or equal to the one selected for STD.
Examples:
- Chart 15m, STD 15m → ✅ OK
- Chart 5m, STD 15m → ✅ OK
- Chart 1m, STD 5m → ✅ OK
- Chart 1H, STD 15m → ❌ Won’t display
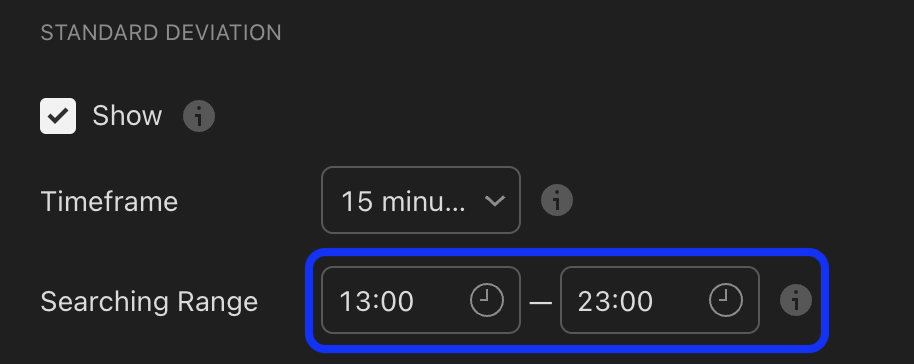
🕐 Step 2: Define the Search Time Range #
By default, the indicator looks for a consolidation between 13:00 and 23:00 (New York time) — these are the classic CBDR hours according to ICT, as they often correspond to consolidation phases.
💡 These hours are based on the timezone you selected in the general settings.
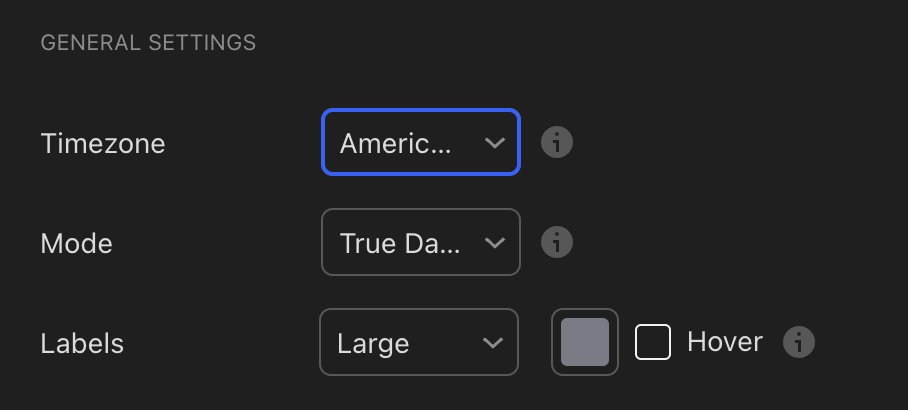
To stick to the ICT methodology, make sure you’re using the America/New_York timezone.
🧠 Step 3: Filter Out Bad Consolidations #
The “Max pip %” setting allows you to limit the size of the detected consolidation.
By default, it’s set to 25.
This means the indicator will only detect a consolidation if its size (in pips) does not exceed the chosen threshold.
💡 This filter helps prevent volatile price movements from being misinterpreted as true consolidations.

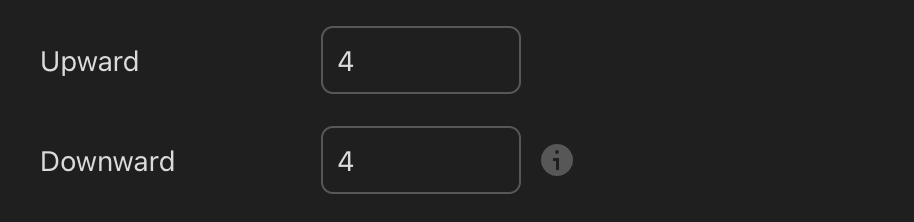
⬆️⬇️ Step 4: Set the Number of Duplications #
You can customize the number of duplications above and below the original zone:
- Upward: number of bullish duplications (potential resistance levels)
- Downward: bearish duplications (potential support levels)
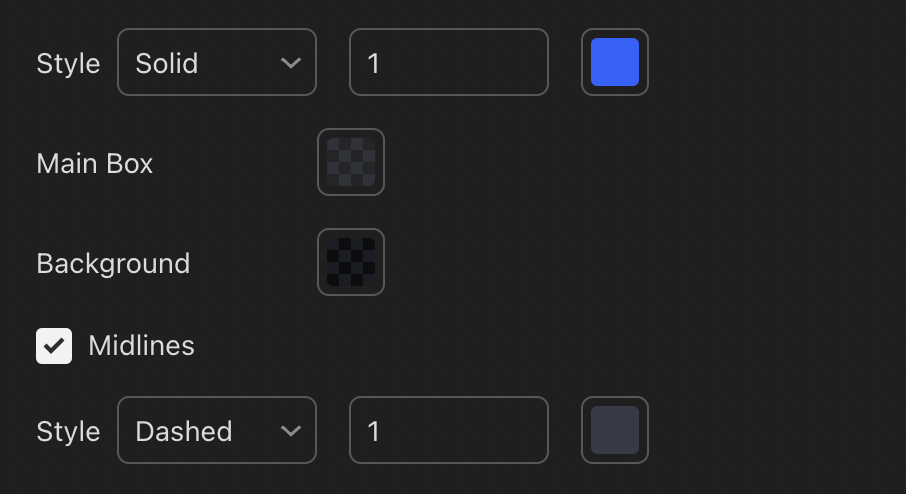
🎨 Step 5: Customize the Display #
The indicator includes several styling options:
- Main Box: color of the original consolidation zone
- Background: fill color for the duplication zones
- Midlines: displays the center line (50%) of each duplication
- Style, thickness, and color of lines: adjust visuals to your preferences
💡 Midlines are often just as relevant as the outer levels, as they correspond to the center of gravity of an accumulation zone — a frequent reaction area.
🧪 Usage Example #
- You’re on the EURUSD 15-minute chart
- You activate the STD with the 13:00–23:00 NY time range
- The indicator detects a consolidation within this range (based on the selected timeframe)
- The configured duplications (e.g. 3 above, 3 below) appear around the detected consolidation
- Price reaches the 2nd upward duplication, which corresponds to a filled BPR and a filled Daily FVG
- Sharp rejection → reversal → move toward the lower STD duplication
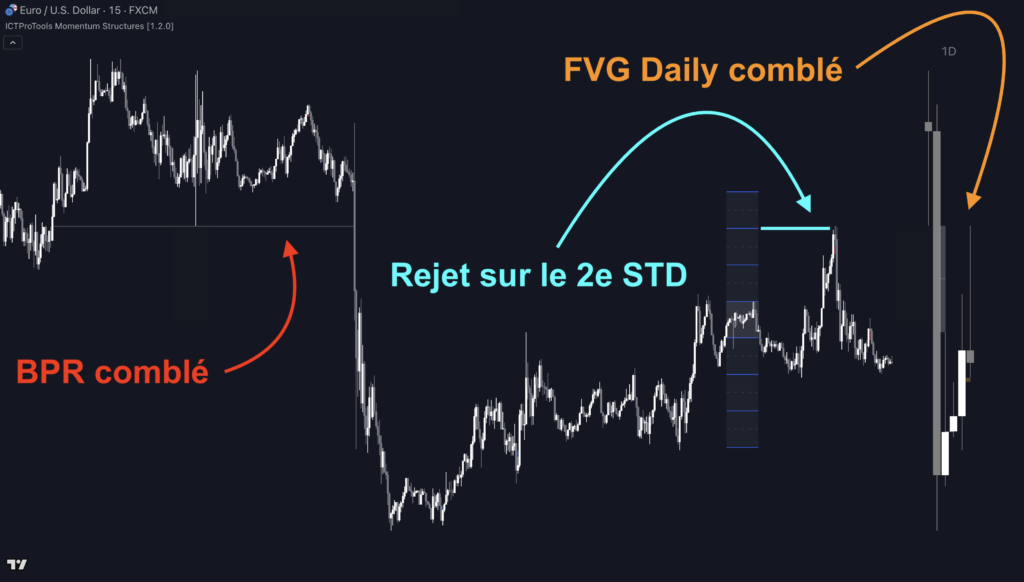
💡 This rejection becomes relevant not because of the STD level alone, but due to its confluence with other key institutional elements.
🧠 Best Practices #
- Never trade solely based on price touching a duplication — assess the context, price behavior, and look for confluence
- Use midlines to fine-tune your entries/exits for scalping or intraday
- Combine with other elements like PO3, FVG, SMT… to validate your scenarios
