⚙️ Power of Three – How to Use It with the Indicator #

Read institutional candles on HTF (Daily, Weekly or Monthly)


🔧 General Settings for PO3 #

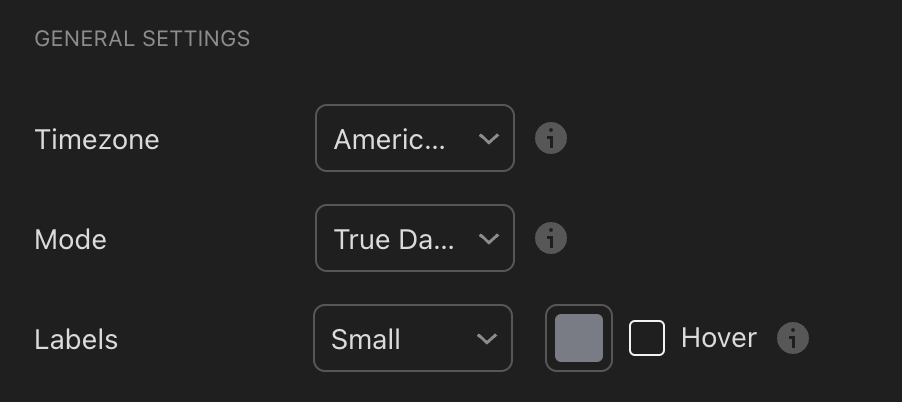
In the General Settings section, you can adjust two important elements:

  • Timezone – Choose your trading timezone (e.g., New York) so PO3 candles align with your active session.
  • Mode – Select between two options depending on your style:
    • Classic: candles are built from 5 PM to 5 PM (futures timing)
    • True Day Range: candles are built from 00:00 to 00:00

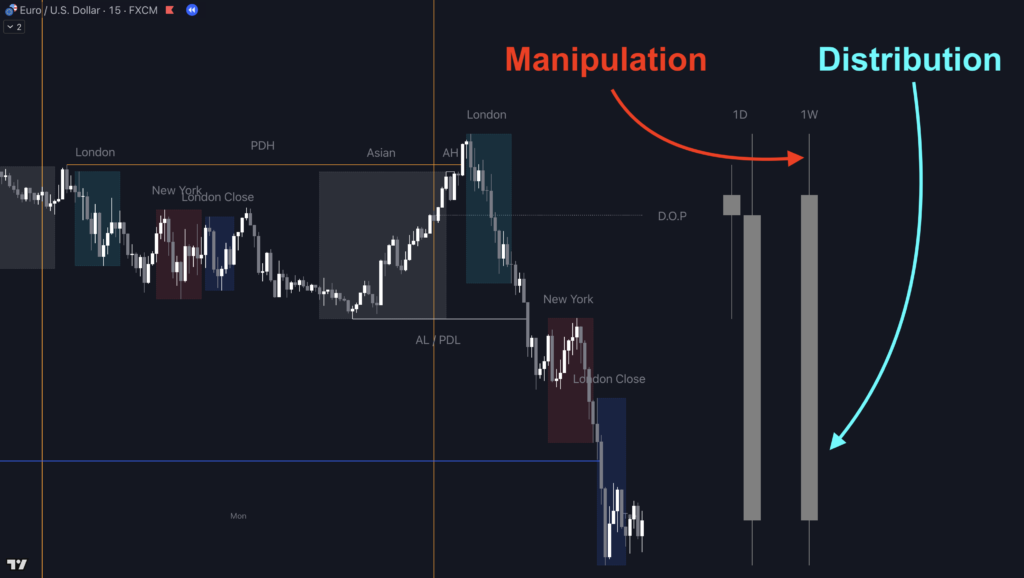
💡 The True Day Range mode is especially relevant for intraday analysis — particularly if you use concepts like the Asian Session, Previous Highs/Lows, or Killzones.

It reflects institutional behavior more accurately by building candles from midnight to midnight New York time — which is exactly what ICT recommends for better market insight.

👉 Want to learn more about this setting and why it matters? Check out the Previous Levels page under the Time & Price Zone indicator.


🧭 Enable PO3 Candles #

In the Momentum Structure indicator settings, go to the PO3 Candles section.

Simply enable the timeframes you want:

  • Daily → to analyze the current day
  • Weekly → to follow the weekly structure
  • Monthly → to observe long-term cycles

You can also choose how many previous candles to display (1, 2, 3, etc.)

💡 If you don’t check anything, nothing will appear. The indicator is fully modular.


🔄 “Show Week’s Candle(s)” Option #

This feature displays only the candles from the current week.

For example:

  • If you select 5 Daily candles and it’s Wednesday, only Monday, Tuesday, and Wednesday will be shown.

💡 Perfect for focusing on the current cycle without cluttering your chart with older candles.


🎨 Visual Customization #

You can customize each part of the HTF PO3 candles:

💡 All settings are designed to match your reading style — without overloading your screen.


🔄 Add Imbalances #

At the bottom of the PO3 section, you’ll find the “Add Imbalances” option:

  • Add Imbalances – Automatically overlays FVGs and VIs inside PO3 candles
    • → Based on the exact configurations you’ve set in the Imbalances section.

Example: if your FVGs are orange/gray with a midline, they’ll appear exactly the same on the PO3 candles.

💡 Perfect to visualize HTF imbalances in their full context. These zones often trigger sharp reactions — especially around the midline.


📍 Example Setup #

Enable PO3 Weekly and PO3 Daily:

  • Show 2 Weekly candles → to track the current structure + any sweep of last week’s high or low
  • Show 5 Daily candles → to follow intraday development
  • ✅ Check Add Imbalances → to highlight internal FVGs/VIs within each PO3 candle


🔎 Multi-Timeframe Interpretation #

  • Weekly candles give you the HTF context
  • They help you identify where we are in the institutional cycle: accumulation, manipulation, or distribution?
    • → If it’s Monday: we’re likely in the accumulation phase
    • → Tuesday/Wednesday: if a high/low is swept, it’s often manipulation
    • → If price already ran a level and becomes directional → we’re likely in distribution
  • Daily candles show you the intraday flow
    • Asian Range = Accumulation
    • London Session sweeps a key level = Manipulation
    • New York Session moves cleanly in the opposite direction = Distribution

You’re seeing the PO3 unfold live, candle by candle, throughout the day.


🎯 Real-World Scenario #

It’s Tuesday morning. The high of Monday has just been swept, triggering a liquidity grab (Manipulation).

Monday was quiet and directionless — a simple consolidation (the Daily candle was almost flat → Accumulation).

After the sweep, price violently reverses and starts dropping. The move continues through the New York session and into London Close.

This is the Distribution phase of the day — and potentially the very beginning of the Weekly distribution.

👉 You’re entering early into a potential institutional HTF move, with a strong risk/reward profile.

⚠️ But stay cautious:

Tuesday’s drop might be…

→ a simple intraday distribution,

→ or a Weekly manipulation disguised as a clean move — if a strong reversal follows later in the week.

📌 To get clarity, combine PO3 with:

  • HTF liquidity levels
  • SMT, Previous Levels
  • IBDR…


💡 This approach helps you: #

  • Situate your current day within the weekly cycle
  • Assess whether a move is clean or risky
  • Filter entries by aligning with the institutional narrative


✅ Recommended Settings Summary #

Was this page helpful?