ICT Insight™
🔧 IBDR – Using the Indicator #
⚙️ IBDR Settings #
Once the indicator is activated, you can customize the display of the IBDR (Interbank Dealing Range) based on your trading style.
Here are the main settings available:
🕒 Timeframe selection #
The indicator draws only one IBDR at a time.
To analyze multiple timeframes (e.g. 1h and 15m), simply add the Market Environment indicator multiple times to your chart, choosing a different timeframe each time.
- 4h/1h: for a broader view of the context (institutional framework)
- 30m / 15m: for entry zones and confirmations

📌 Important: You can’t display an IBDR with a lower timeframe than your current chart.
For example, a 15m IBDR won’t appear on a 1h or 4h chart.
🧭 IBDR Sensitivity #
You can adjust the sensitivity based on the level of strictness required for detecting an IBDR:

- High: An IBDR is detected quickly (on more frequent movements)
- Medium: Balanced frequency and relevance
- Low: Only significant moves are considered (extreme highs and lows are more protected)
📌 Ideal if you want to filter out noise and focus on the clearest institutional structures.
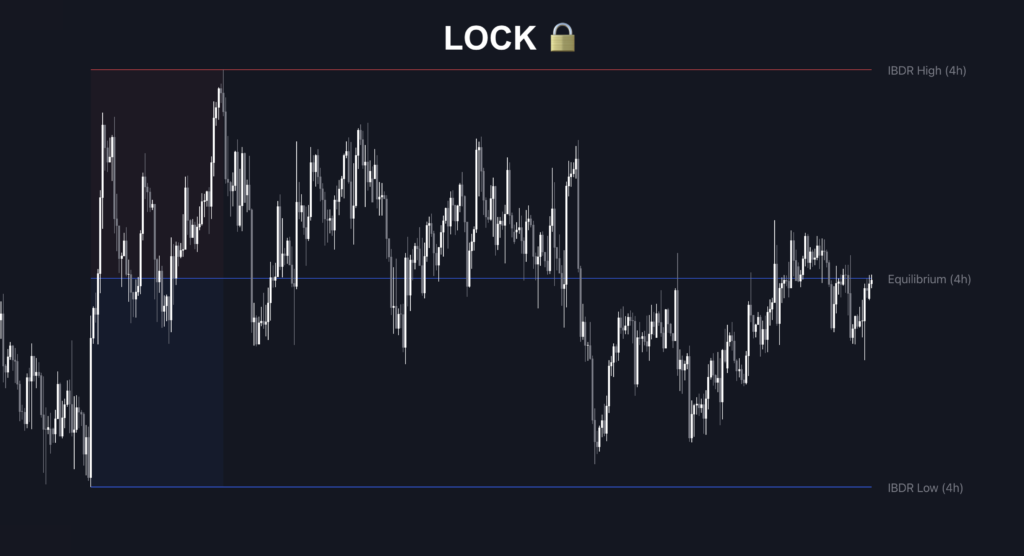
🔒 “Lock” Option: Maintain Control #
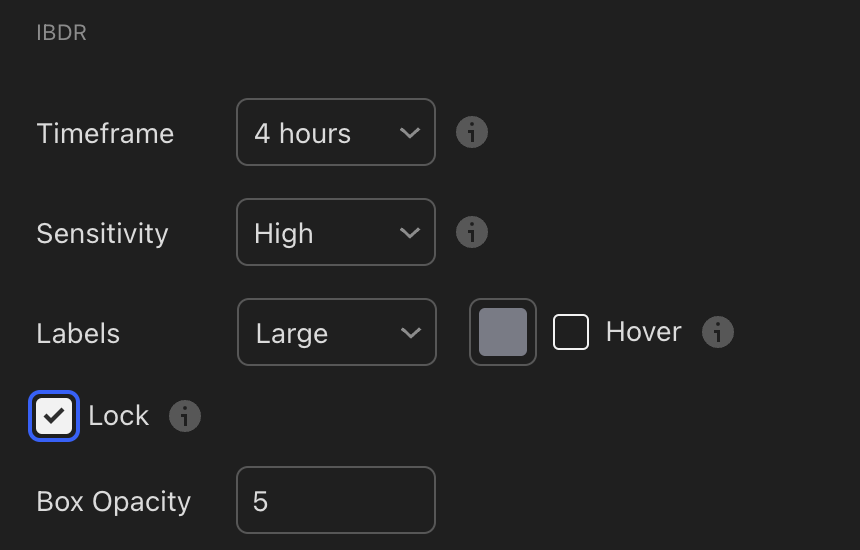
The Lock setting, when enabled, prevents the indicator from drawing a new IBDR unless the current one has been broken (price has hit the High or Low).
👉 This lets you freeze a specific range until it’s taken out.
If Lock is disabled, a new IBDR may appear even if the current one hasn’t been broken yet, as soon as a new configuration is detected.
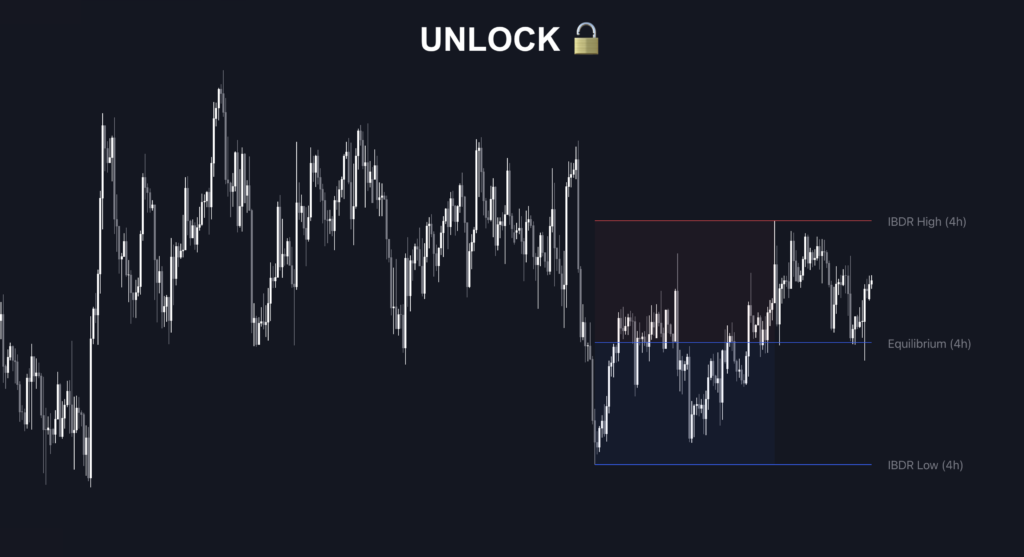
📌 Note: When an IBDR is broken (its High or Low is taken), it automatically disappears.
If no IBDR is visible, it’s either because the conditions haven’t been met yet, or the IBDR’s timeframe is lower than your chart’s timeframe.
📊 Levels to display #
You can choose which levels to display inside the IBDR:
- 0 (IBDR Low) and 1 (IBDR High): the range extremes
- 0.5 (Equilibrium): the midpoint of the IBDR
- 0.25 / 0.75: to refine reaction zones
- OTE (0.382 / 0.618): ideal retracement levels for entries


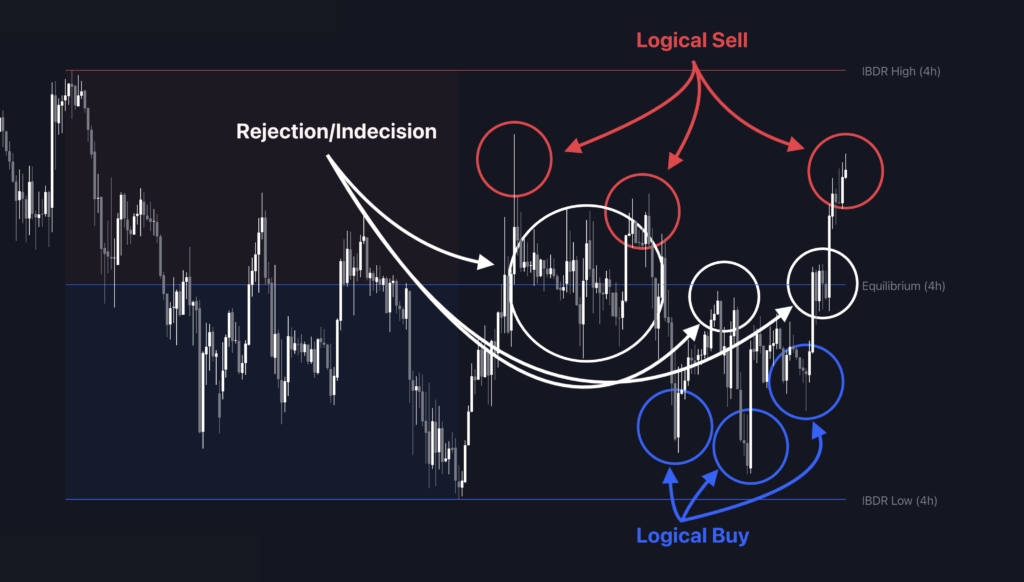
🎯 Market reading with IBDR #
Once the IBDR is displayed, here’s how to interpret the zones:
🔵 Discount Zone
- “Cheap” price
- Logical area to buy
🔴 Premium Zone
- “Expensive” price
- Logical area to sell
⚪ Equilibrium (0.5)
- Neutral but strategic zone
- Possible rejection area
- Can be used to partially close a position
💡 Institutions often use the Equilibrium level to return to break-even after triggering a strong move. It’s a frequent reaction point and shouldn’t be overlooked.
🚀 Usage Example (Multi-Timeframe) #
- IBDR 1h = general context
- IBDR 15m = local confirmation
👇 Classic example:
- Price enters the Premium of the 1h IBDR
- A new 15m IBDR forms → potential reversal zone
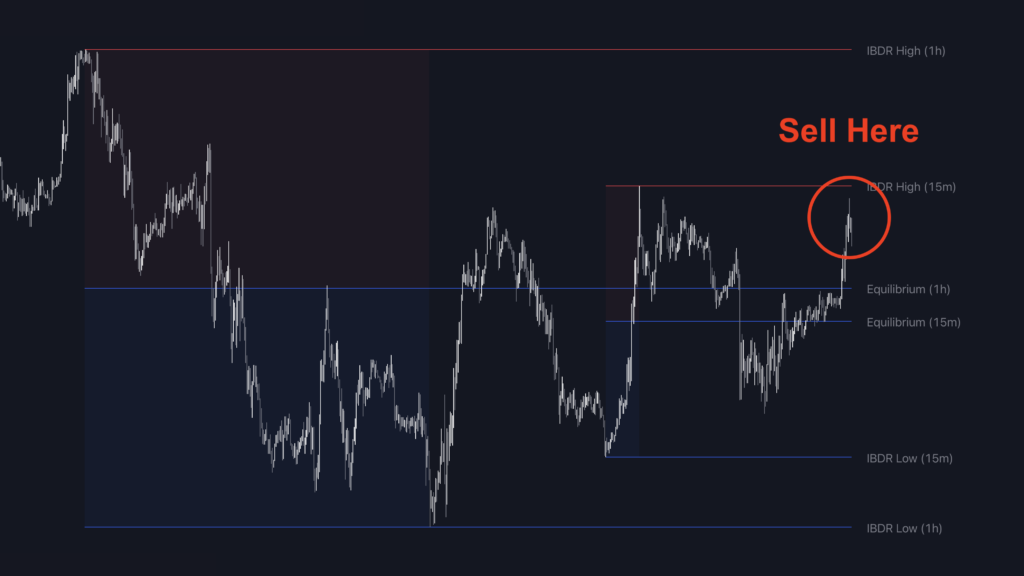
- Price drops toward the Discount → target reached (liquidity taken and move confirmed)

📌 Usage Tips #
- Avoid buying in Premium or selling in Discount
- Use alerts to be notified when a new IBDR is drawn or when an extreme is broken
- Combine with other modules (SMT, Killzones, FVG…) to improve signal quality
🧠 This visual framework helps you filter out poor setups and stay aligned with Smart Money logic.
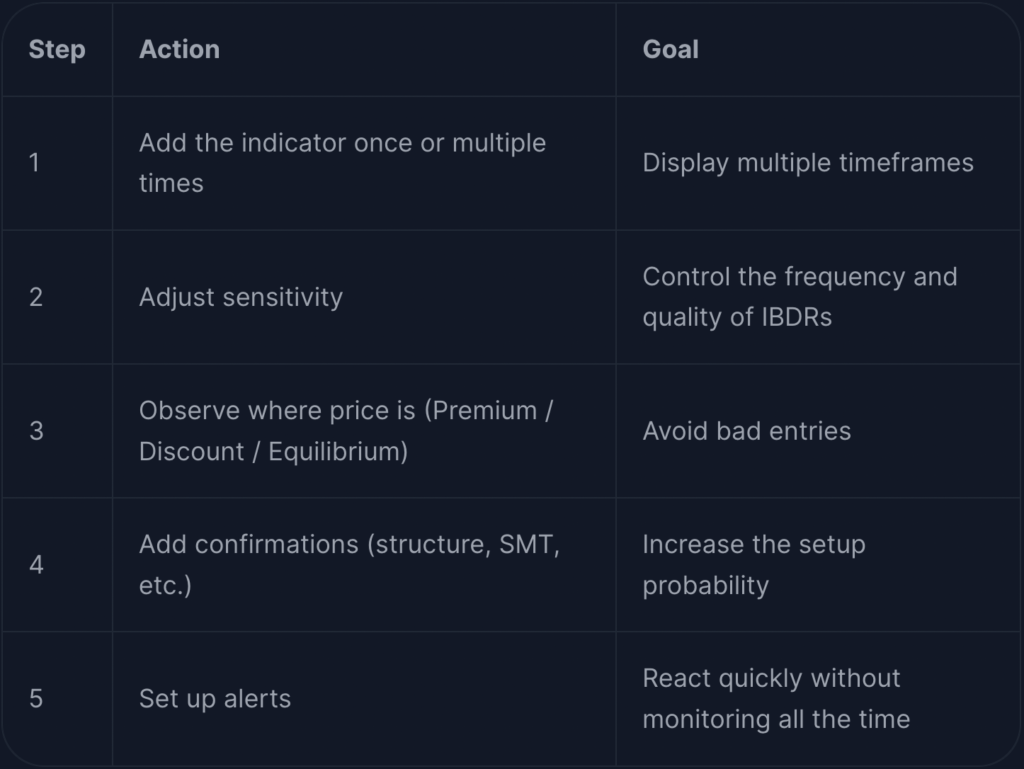
✅ Summary: How to Use the Market Environment Effectively #