ICT Insight™
📈 Momentum Structure – Introduction #
The Momentum Structure indicator is based on core ICT (Inner Circle Trader) concepts, offering an advanced view of price dynamics through imbalances, HTF structures, and institutional consolidation zones.
It is designed to help traders:
- Identify key turning points
- Anticipate price movements
- Understand the institutional logic behind market phases: accumulation, manipulation, distribution
📌 Indicator Objective #
Momentum Structure answers the key question:
“What’s the logic behind the current price move?”
To do so, it combines 4 complementary modules:
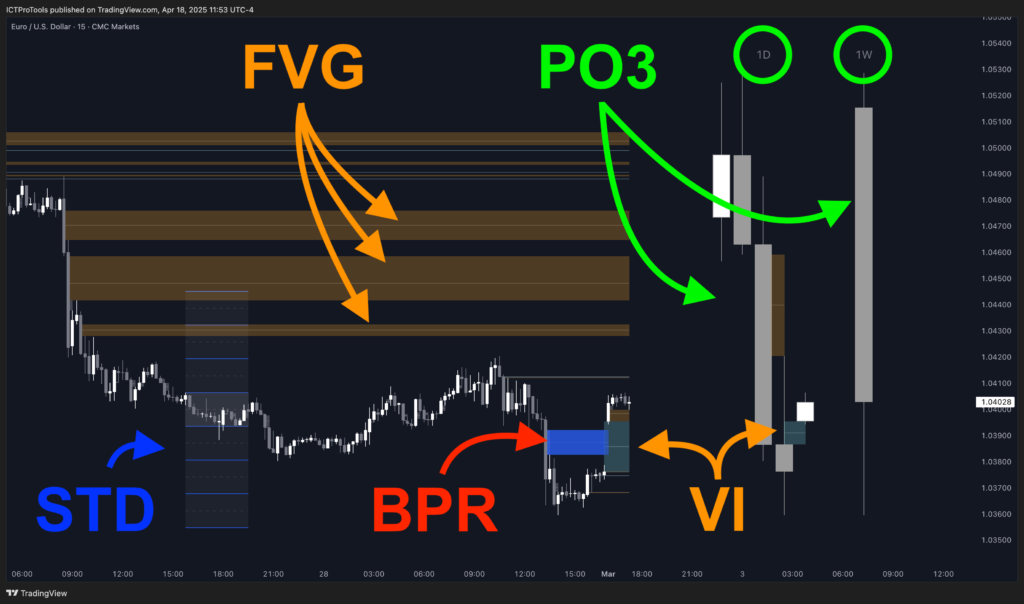
🟧 FVG / VI (Fair Value Gap / Volume Imbalance) #
Detects institutional price imbalances caused by rapid moves. These zones often act as Points of Interest (POI) where price is likely to react.
🟥 BPR (Balanced Price Range) #
Identifies areas where two FVGs overlap, strengthening the imbalance. These overlaps highlight even more powerful institutional zones, often used as advanced support/resistance.
🟩 PO3 (Power of Three) #
Displays HTF candles (Daily, Weekly, Monthly) based on the ICT cycle “Accumulation → Manipulation → Distribution”, allowing you to follow institutional phases at a glance.
🟦 STD (Standard Deviation) #
Detects a consolidation within a specified time range (CBDR), then duplicates it above and below the current price.
This helps anticipate reaction zones—often used to target likely highs/lows of the day or week.
📌 Note: The indicator does not duplicate the CBDR directly. It first detects a proper consolidation within the range before replicating it.
🧠 Who is it for? #
Whether you’re:
- A beginner looking to avoid false signals and understand where and why price reacts
- An intermediate trader seeking clearer confirmations using visual anchors (gaps, cycles, consolidations)
- An advanced trader aiming to anticipate moves by combining accumulation zones, imbalances, and optimal timing
👉 Momentum Structure provides powerful tools to:
- Understand key reaction zones
- Identify strategic entry points
- Read market phases (accumulation, manipulation, distribution)
- Visualize key imbalances and institutional traps
⚙️ Modularity & Customization #
Each module of the indicator is 100% customizable:
- Choose which features to activate (FVG, VI, BPR, PO3, STD)
- Customize FVG/VI visuals (color, extension, auto-delete…)
- Toggle BPR display (color, opacity, extension, auto-delete…)
- Select PO3 candle timeframes (Daily, Weekly, Monthly)
- Choose the timezone and calculation mode (True Day Range or standard)
- Full STD customization: number of duplications, midlines, time ranges, sessions, etc.
👉 Whether you’re a scalper, day trader, or swing trader – the indicator adapts to your workflow.
📍 Special Note #
Unlike other modules in the ICTInsight™ suite (Time & Price Zones, Market Environment), Momentum Structure does not trigger automatic alerts.
It is designed for manual visual reading, highlighting the strongest zones likely to attract or repel price, allowing for deeper contextual analysis.
🔍 What You’ll Find in This Section #
Each concept included in Momentum Structure is explained in detail—both in theory and in practice—so you can progressively integrate it into your trading:
- FVG / VI – Theory: Understand institutional imbalances
- FVG / VI – Application: Use gaps as reaction zones
- BPR – Theory: Understand the power of overlapping FVGs
- BPR – Application: Use BPR as advanced POIs
- PO3 – Theory: Read HTF candles using ICT phases
- PO3 – Application: Track institutional cycles with the indicator
- STD – Theory: Identify institutional consolidations
- STD – Application: Anticipate probable highs/lows using duplications
- FAQ – Common questions answered to help you use the indicator effectively
- (Coming Soon) Use cases – Learn how to combine modules in real trading situations
