ICT Insight™
📘 Case Study No. 4 – ICT Insight™ #
🗓️ Date: 02/07/2025
💱 Pair: US30
⏱️ Timeframe: 15m
📉 Trade Type: Short
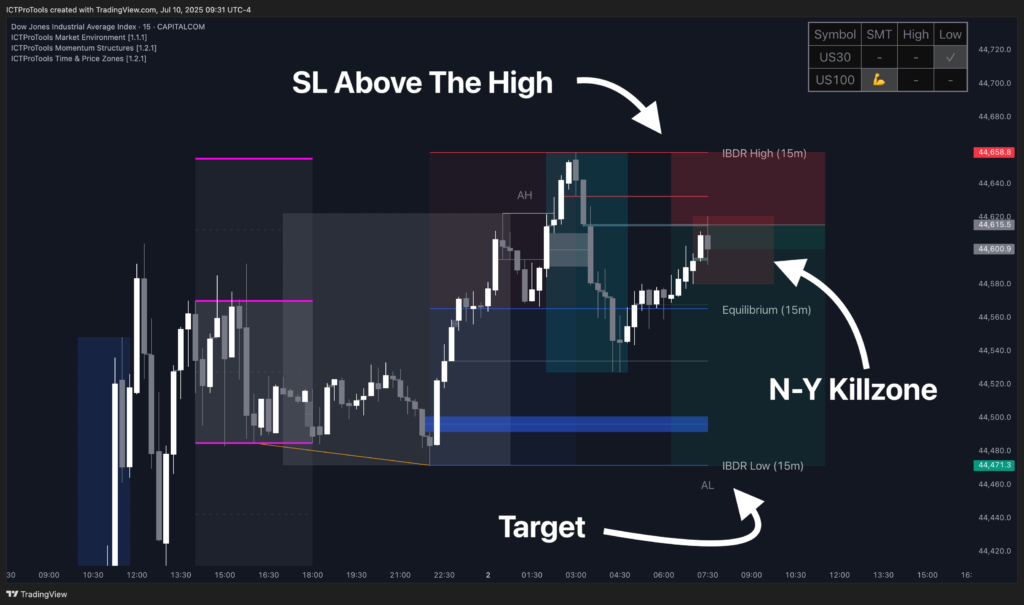
🧠 Concepts Used: STD, SMT, BPR, VI, FVG, PO3, Killzones
In this fourth case study, we analyze a short trade setup based on the combination of several key elements.
This setup perfectly illustrates confluence between several concepts from the ICT methodology, all represented by our ICT Insight™ indicators:
- Time & Price Zones for visualizing Killzones and SMT,
- Market Environment for the IBDR,
- Momentum Structure for the BPRs, VIs, STD levels, and the PO3.
This trade is featured as a short-form video on our YouTube channel. For now, let’s break it down step by step with screenshots and clear explanations.
🔍 Step 1 – General Context #
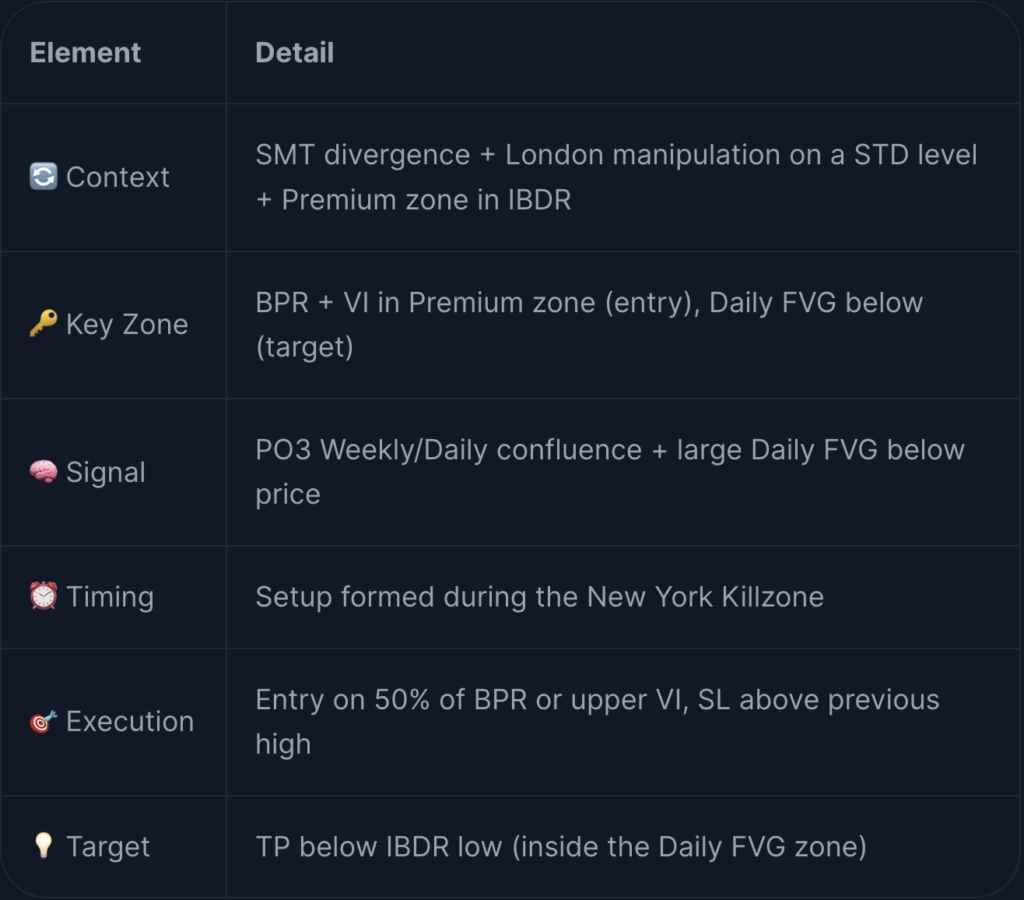
We are on US30, 15-minute timeframe, on Wednesday, July 2, 2025.
During the London session, price rises sharply and hits a key STD level, the upper duplication, before reacting aggressively and beginning a strong drop.
This initial drop immediately creates several imbalances visible through the Momentum Structure indicator: cascading VIs and the formation of BPRs, reflecting a sudden surge in imbalance.
In parallel, an SMT divergence had been identified earlier during the Asian session: US30 swept its previous low while US100 did not. This indicates structural weakness on US30, reinforcing the bearish bias.
This divergence does not trigger the trade itself but fits within the broader context that validates our bearish outlook.
A BPR is also visible near the bottom of the IBDR zone, just before its low, a potential secondary target worth noting.
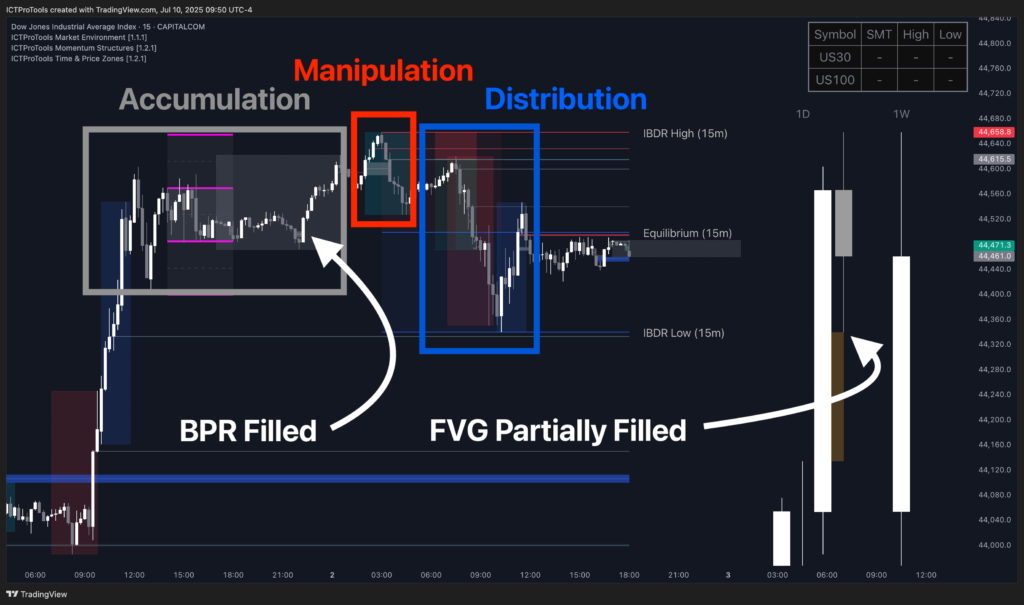
📍 Step 2 – PO3 (HTF) Reading #
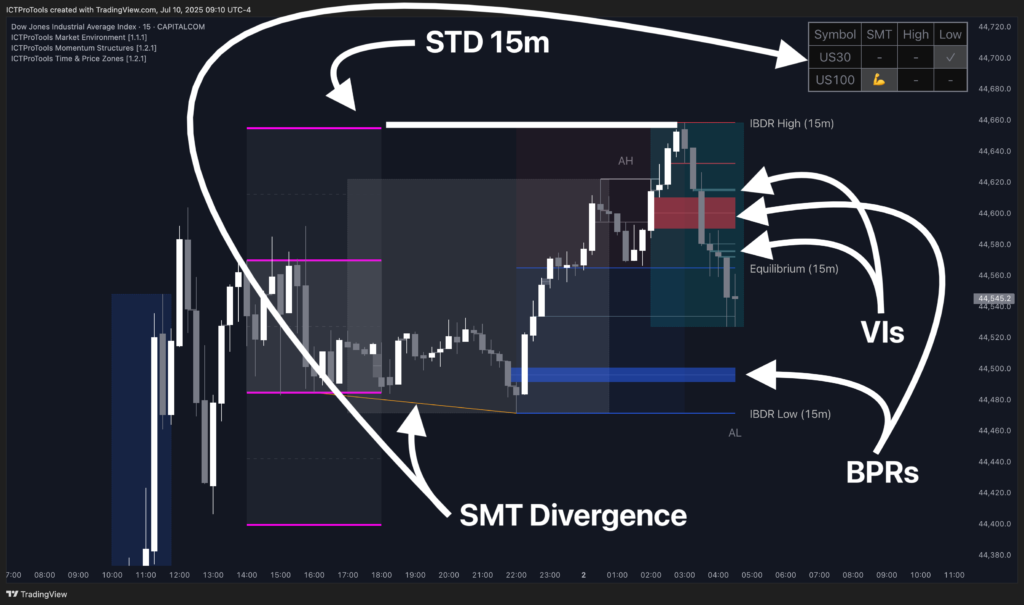
Thanks to the PO3 module, two higher-timeframe candles help us understand the broader context:
• The Daily candle reveals a large FVG just below the current price — an unfilled imbalance likely to act as a natural bearish target.
• The Weekly candle is strongly bullish, showing that Monday and Tuesday were clearly upward days. According to ICT methodology, early-week moves are often manipulation phases, with mid-week (Wednesday in this case) offering prime reversal conditions and real directional moves.
Moreover, the behavior observed here, consolidation during the Asian session, a false move up during London, and then rejection from a STD level; fits perfectly into a PO3 scenario (accumulation – manipulation – distribution).
🎯 Step 3 – Technical Setup (Execution and Killzone) #
After the initial drop, price consolidates around the IBDR 15m equilibrium.
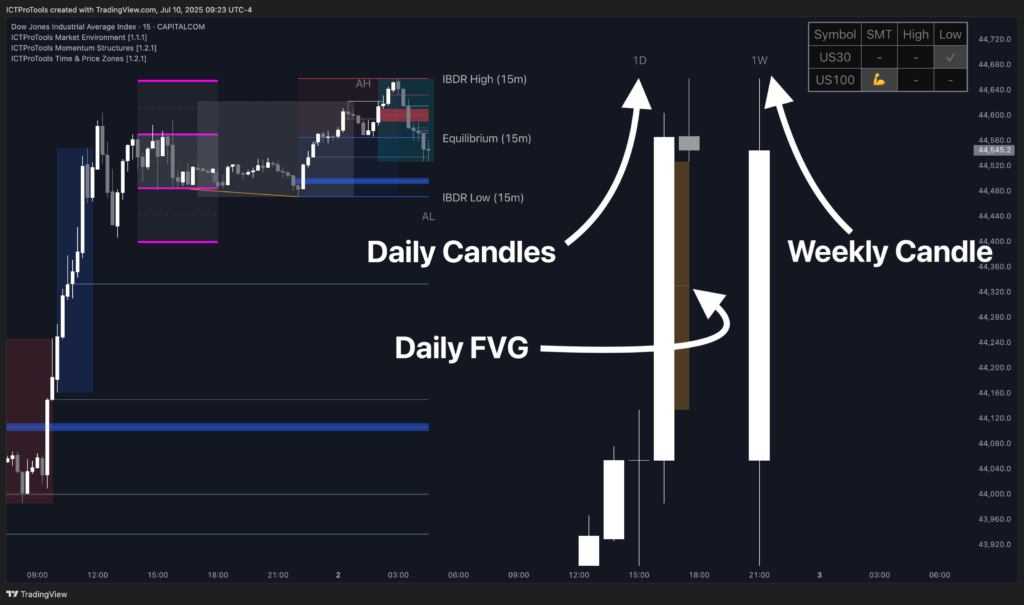
We are now in the heart of the New York Killzone, the session typically known for extending the day’s main move. In this case, it’s the bearish continuation set up by the London session.
Three VIs are visible in the Premium zone. Among them, the highest one is selected as the optimal entry area, with a BPR also providing support.
→ Entry is placed either at the 50% level of the BPR or on the body of the upper VI, depending on your strategy.
The Stop Loss is set just above the previous structural high.
The Take Profit is set below the IBDR low, in the area of the previously mentioned Daily FVG, which also aligns with the Asian Low.
Price rises to fill most of the VIs and BPRs as expected. The VI used for entry remains visible, since it was only touched by a wick, not filled by the body of a candle.
✅ Step 4 – Trade Outcome #
Once the entry is triggered, price drops sharply:
• It breaks the IBDR low, which also corresponds to the Asian Low
• It partially fills the Daily FVG identified via PO3
• It also fills the BPR located in the Discount zone, just before the IBDR low
• It respects the PO3 structure identified earlier to the letter
This setup provided an excellent risk-to-reward ratio, combining inter-timeframe context, precise imbalance zones, and SMT confirmation.
📊 Trade Recap #