ICT Insight™
📘 Case Study #3 – ICT Insight™ #
🗓️ Date: 05/19/2025
💱 Pair: US30
⏱️ Timeframe: 10m
📈 Trade Type: Long
🧠 Concepts Used: IBDR, SMT, BPR, VI, STD, Killzones
In this third case study, we analyze a long trade setup based on the combination of several key elements: reaction on an STD zone, SMT divergence, presence of BPRs, entry on a VI, all occurring in a Discount zone during the New York Killzone.
This setup clearly illustrates a confluence of multiple ICT concepts, all of which are represented by our ICT Insight™ indicators:
- Time & Price Zones for visualizing Killzones and SMT,
- Market Environment for the IBDR,
- Momentum Structure for the BPRs, VIs, and STD.
This trade is featured as a short-form video on our YouTube channel. For now, we’ll break it down step by step using clear screenshots and explanations.
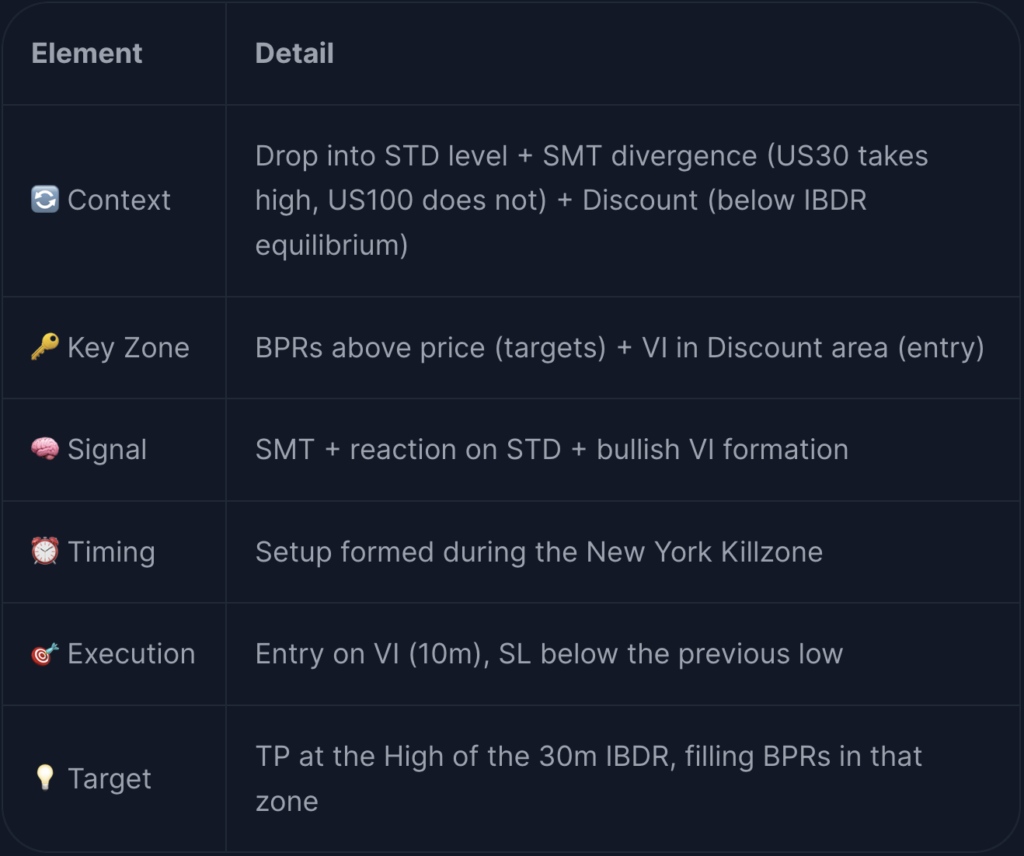
🔍 Step 1 – General Context #
We’re on US30, 10-minute chart. Price drops sharply at the start of the London session, reaching an STD (Standard Deviation) level identified on the 15m.
This STD level may mark the day’s low, if price shows a solid reaction.
Price starts moving up again, and a bullish SMT divergence appears:
→ US30 sweeps its previous high, while US100 does not. This suggests US30 is the stronger asset, supporting the idea of a reversal.
Price is also in a Discount zone (below the equilibrium of the 30m IBDR), which further strengthens the bullish bias.
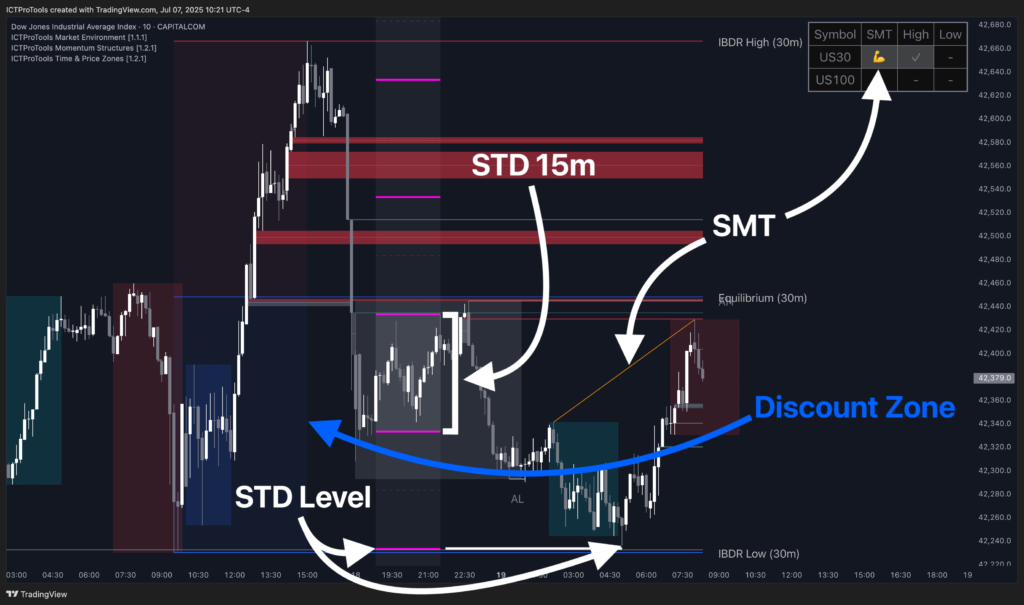
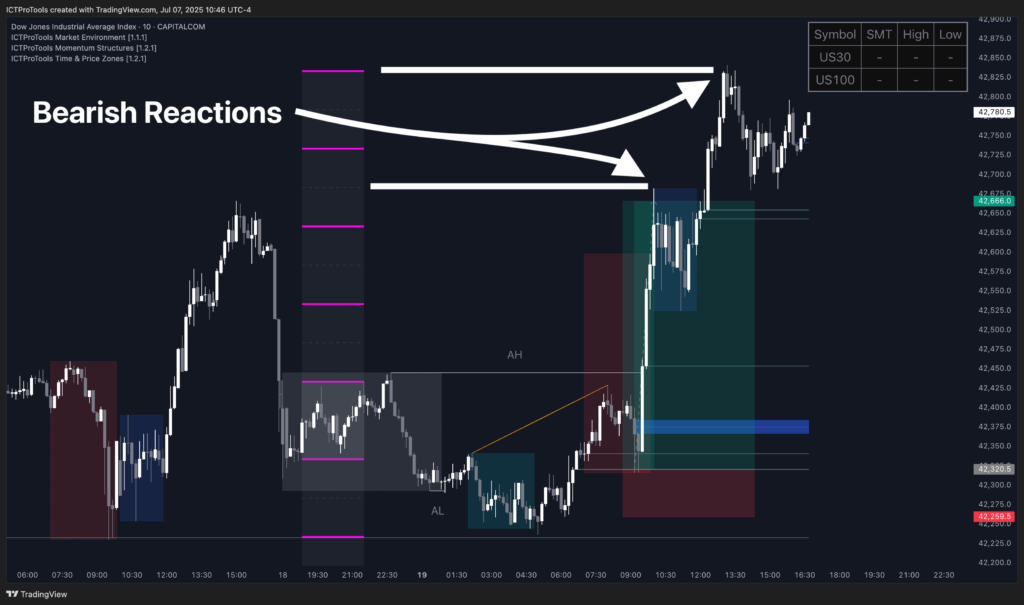
📍 Step 2 – Presence of BPRs (Balanced Price Ranges) #
Looking at the price structure:
• Several BPRs (Balanced Price Ranges) are visible above price, all located in the Premium area of the IBDR.
• Three VIs (Volume Imbalances) form in the Discount area, shortly after the reaction to the STD level.
→ The lowest VI will be used as the main entry level, as it offers the best possible Risk/Reward optimization.
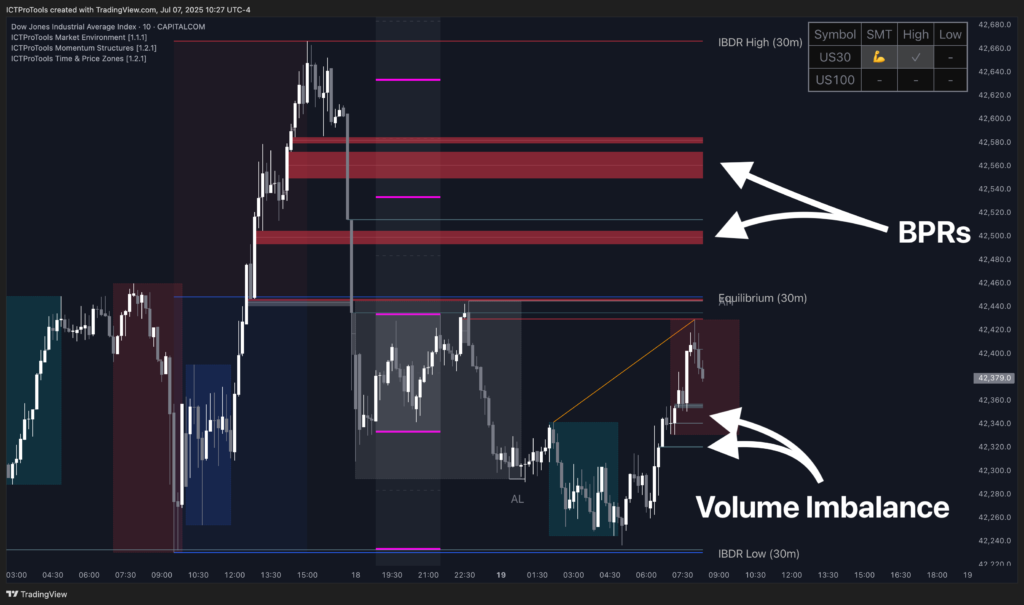
🎯 Step 3 – Entry, SL and TP #
The trade is entered directly on the identified VI.
We are now in the middle of the New York Killzone, which further increases the likelihood of continuation after the reaction on the STD.
Indeed, the New York session is often where the day’s main move unfolds, following the manipulation laid out during the London session.
In this context, a sharp bullish expansion becomes all the more likely.
This setup provides a clean entry zone, with:
• a precise VI level for execution,
• and the BPRs above acting as natural liquidity targets.
The Stop Loss is placed below the previous structural low.
The Take Profit is set at the High of the 30m IBDR, where several BPRs are stacked and likely to be filled.
✅ Step 4 – Trade Outcome #
After triggering the entry on the VI, price quickly accelerates:
• It reaches the High of the IBDR (main TP),
• and fills the BPRs located in the Premium area of the IBDR.
The position offered a solid risk/reward ratio and could have also been partially managed to capture more upside.
As we can see, price reacted precisely at the STD levels, this is no coincidence, but a reflection of institutional behavior that can be studied and leveraged.
📊 Trade Recap #