ICT Insight™
📘 Case Study #1 – ICT Insight™ #
In this first case study, we’ll thoroughly analyze a long (buy) trade based on ICT concepts, implemented through our ICT Insight™ indicators.
This trade is featured in our first YouTube video (📺 watch the video), and we’ll walk through each step here with annotated screenshots and simple explanations.
🔍 Step 1 – Context on the Analysis Timeframe (10m) #
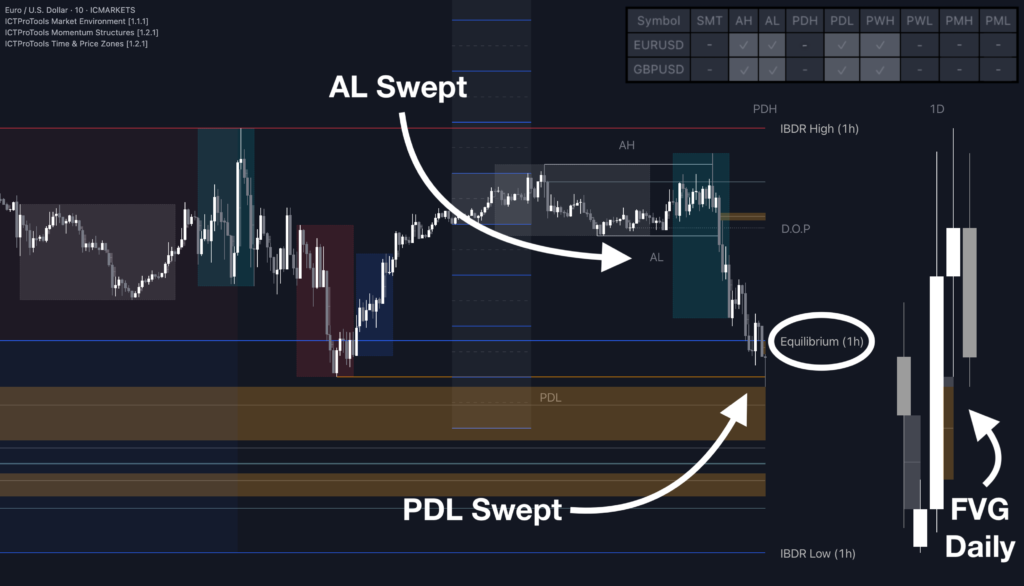
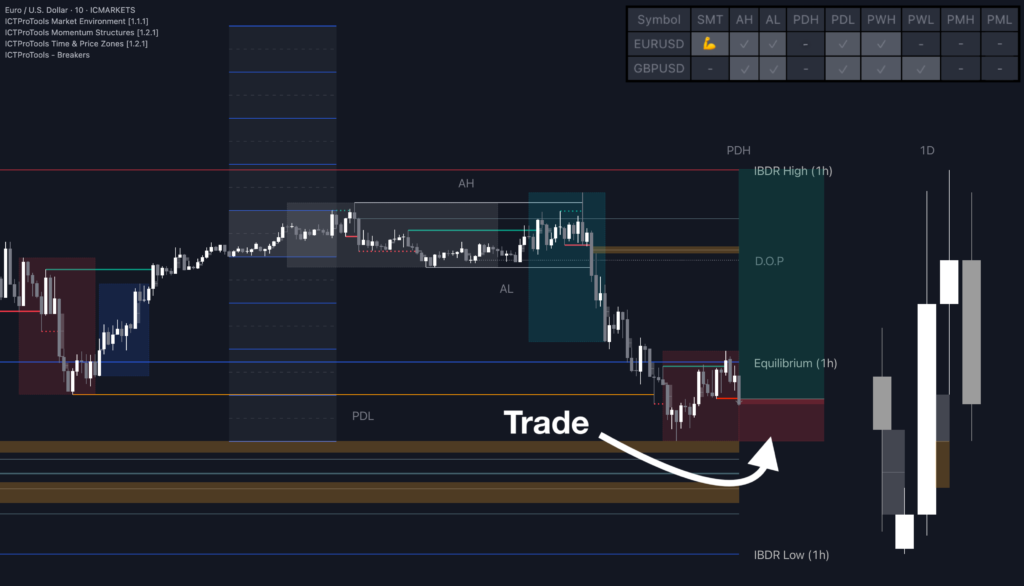
We begin the analysis on EURUSD, using the 10m timeframe as our main view.
We observe the following:
- The Asian Session Low has been swept
- The PDL (Previous Day Low) has also been taken
- Price is currently trading below the 1h IBDR equilibrium, meaning we’re in a Discount environment
- And finally, based on the PO3 Daily Candles, price is reacting to a Daily FVG, not far from its 50% level
These factors suggest a potential bullish reversal, but further confirmation is needed.
📍 Step 2 – Reaction on a Key Zone (multiple confluences) #
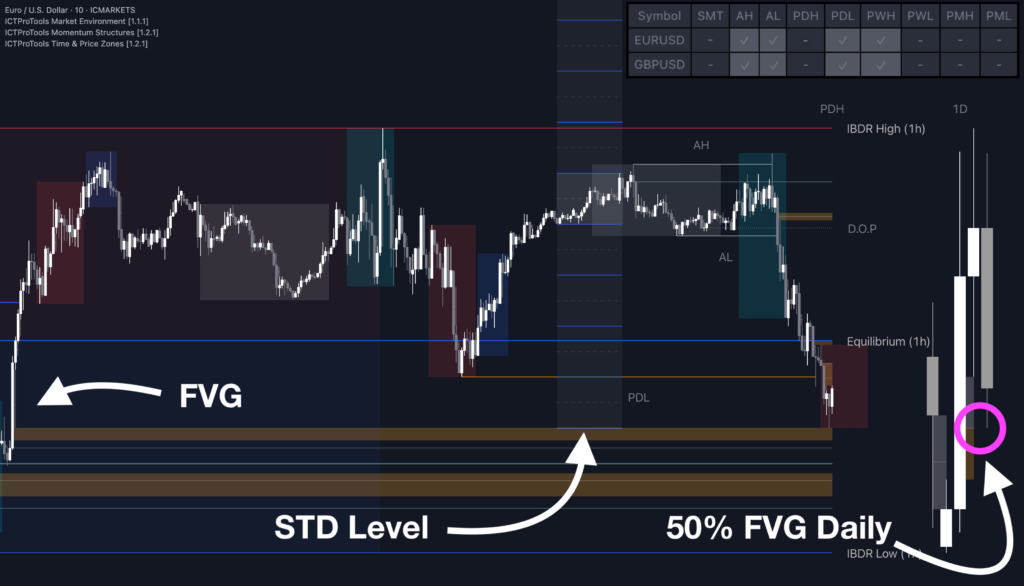
Price drops again and this time:
- Reacts precisely at the 50% level of the Daily FVG
- Hits the 4th lower level of the STD module (Standard Deviation, based on a consolidation between 1 PM and 11 PM NY time)
- Fills a large portion of a previous M10 FVG caused by the last impulsive move
👉 This triple confluence (HTF imbalance + STD duplication + local FVG) strongly suggests a potential day low is in place.
We now enter the confirmation phase.
📈 Step 3 – Reversal Signal & Entry #
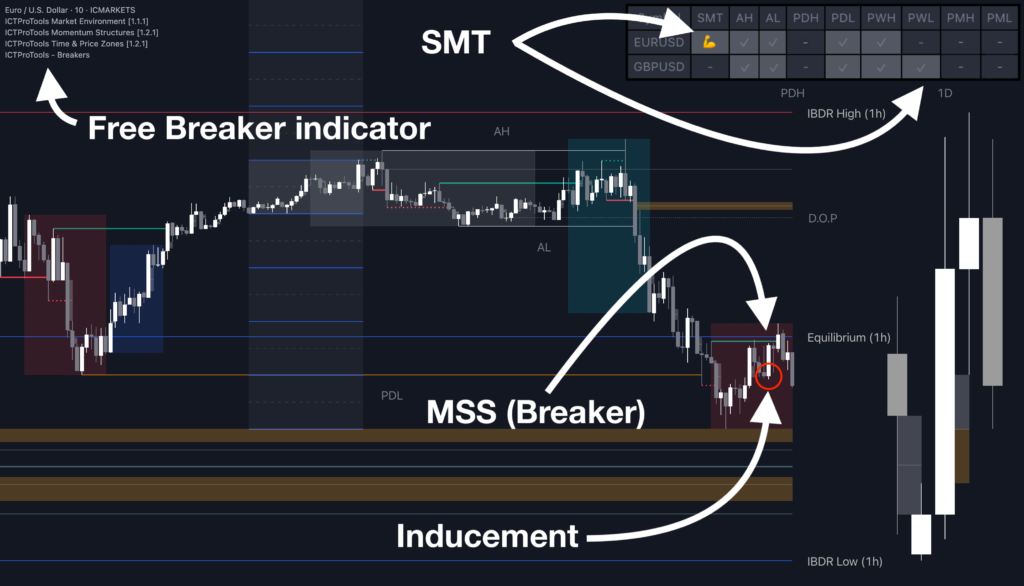
At this point, several elements suggest a reversal is underway:
- Price reacts to the confluence of FVG + STD + Daily FVG
- It forms a breaker (clear shift in market structure)
💡 (If you have trouble spotting these structure breaks or want to detect them faster, feel free to use our free indicator “ICT Breakers (BOS / MSS – Market Structure)” on TradingView. It automatically highlights BOS and MSS for you.)
- An inducement (a liquidity swing just before the move) is also created
- Most importantly, we see an SMT divergence: → GBPUSD sweeps its PWL, but EURUSD does not, indicating EURUSD is relatively stronger
We now have all the ingredients for a potential entry.
⏰ Important note:
This trade is prepared during the New York session and unfolds during the London Close session, a time well-known for triggering retracements and reversals, especially after strong expansions like the one observed here.
This timing adds even more confidence to the likelihood of a bullish move.
🎯 Two Entry Options:
Option 1 – Safer Entry (great for beginners) #
- Stop loss placed below the recent low (STD reaction)
- Entry on the inducement or at the candle close
Option 2 – Advanced Entry on LTF (1m) #
For more experienced traders looking for precision:
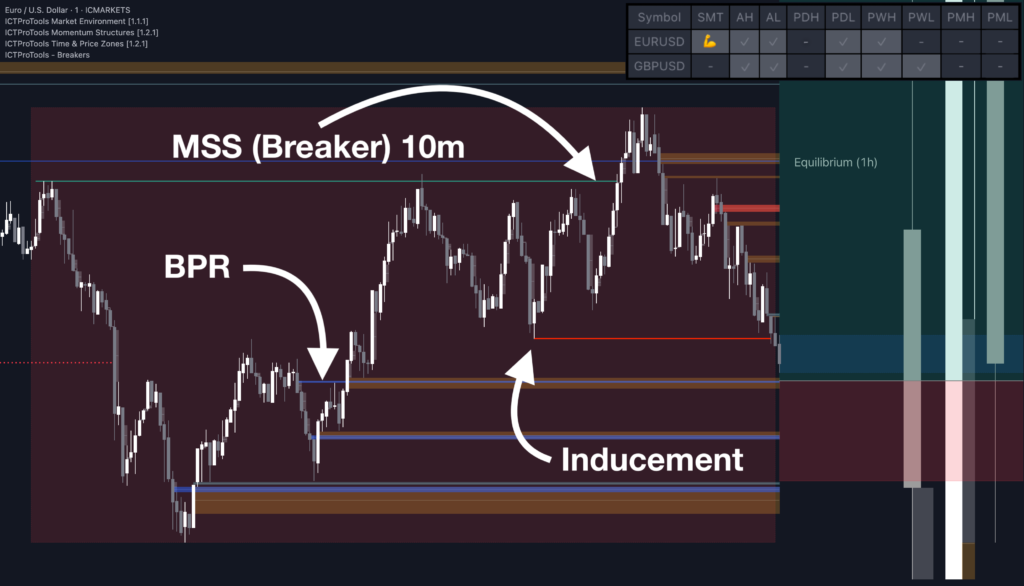
- Just below, a BPR (overlapping FVGs) forms
- The same breaker structure is visible on 1m
- Followed by a clear inducement

🎯 You can enter:
- On the BPR, with a SL below the swing low beneath it
- Or on the inducement on 10m, for those staying on the analysis timeframe
⚠️ Note: A trade taken on the 1m BPR offers a better risk/reward, but it’s also more exposed to fake-outs.
It therefore requires more experience and execution precision to avoid getting trapped.
🎯 Step 4 – Trade Outcome & Management #
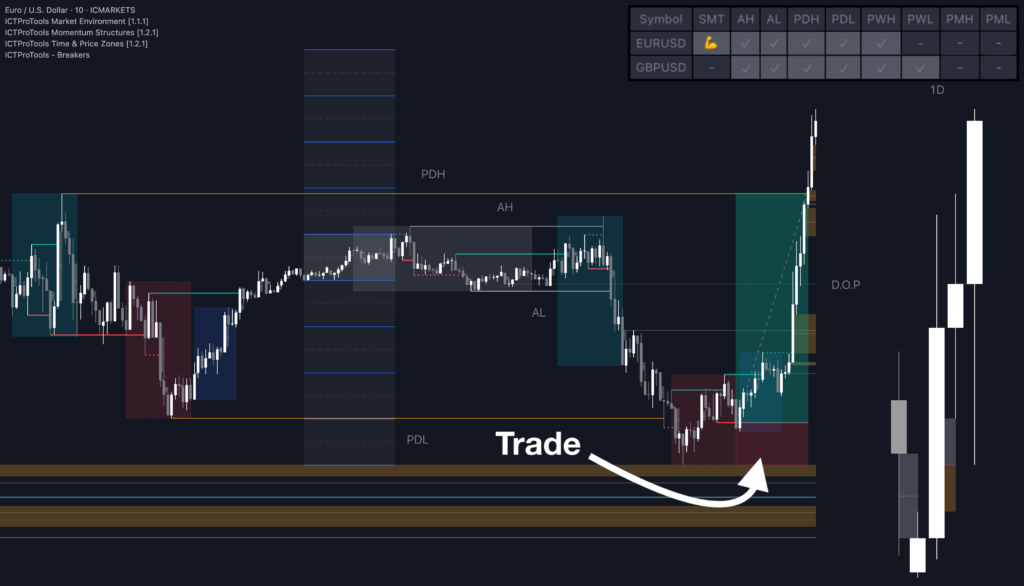
After entry:
- Price accelerates quickly
- Reaches a 3R target, allowing the stop to be moved to break even
- Then continues higher, reaching a key liquidity area (Equal Highs, FVG, or IBDR High)
🎯 In this specific case, the target was the High of the 1h IBDR, which also aligned with the PDH (Previous Day High) — a perfect level to close the trade.
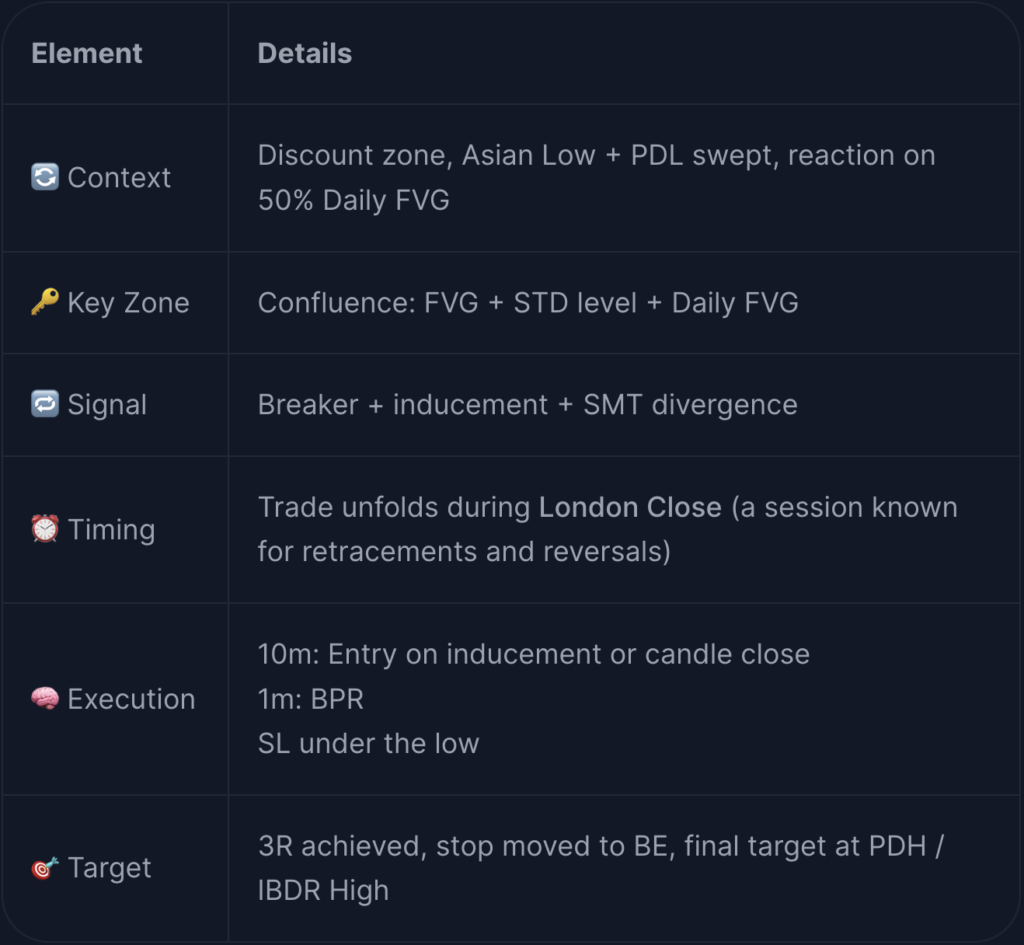
✅ Setup Summary #