ICT Insight – Market Environment
🚀 INTRODUCTION
The Market Environment Indicator provides traders with an essential contextual framework for analyzing price movements. Built on the principles of ICT (Inner Circle Trader) and Smart Money Concepts (SMC), this tool offers a structured view of how institutional players drive markets through liquidity manipulation and price level interactions. By defining the market environment, the indicator helps traders focus on the most relevant price zones, reducing distractions and enhancing decision-making.
At its core, the Interbank Dealing Range (IBDR) creates a clear structure of protected highs/lows and Premium/Discount zones, highlighting key areas for potential price reactions. This framework gives traders a lens to interpret market behavior and concentrate on meaningful liquidity zones and price action. The indicator helps traders navigate the market with precision, spotting significant opportunities while filtering out market noise. Indeed, the IBDR isn’t always easily identifiable, and not every move will form a distinct dealing range.
This indicator goes beyond mere price levels… It reveals the larger market context in which prices evolve. By mastering this environment, traders can align their strategies with institutional logic and make well-informed decisions.
💎 FEATURES
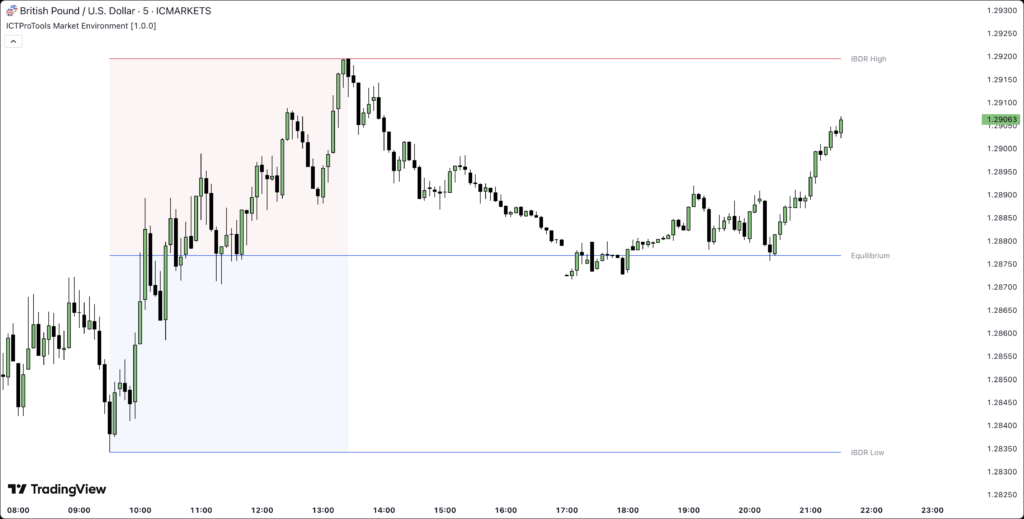
The Interbank Dealing Range (IBDR) is a crucial concept within the ICT methodology that helps traders identify the market environment across multiple timeframes, specifically the premium and discount zones. The IBDR delineates areas where traders have the potential to buy low and sell high.
Its extremes are defined by the sweep of both buy-side and sell-side liquidity. These levels indicate the boundaries within which price is expected to evolve. Understanding these boundaries allows traders to determine where it is appropriate to enter or exit trades.
The primary goal of utilizing the IBDR is to capitalize on price movements by buying at discounted levels and selling at premium levels. This strategy aligns with the fundamental principle of trading: to buy at lower prices and sell at higher prices, maximizing profit potential.
By visualizing the IBDR on your charts, you can gain valuable insights into the prevailing market conditions and make informed trading decisions that align with the institutional approach to buying and selling.
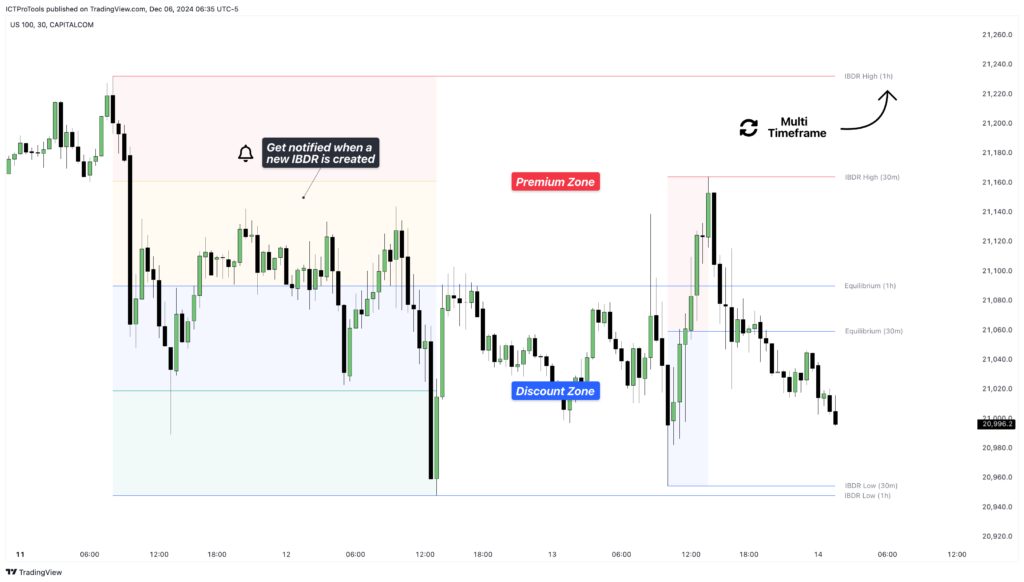
This chart illustrates the Interbank Dealing Range (IBDR) applied to the US100 index, displaying two from different timeframes: a 1-hour (1h) IBDR on the left and a 30-minute (30m) IBDR on the right. This multi-timeframe view provides essential context for price action analysis.
The 1h IBDR could here function as the primary reference range, establishing key boundaries (High and Low) for price movement. Within this range, the Equilibrium (midpoint) separates the Premium zone (above) from the Discount zone (below). The 0.25 and 0.75 levels add further precision by subdividing these zones.
Price action then flows between these zones, creating and targeting liquidity at higher and lower levels through Relative Equal Highs and Lows. A strong upward movement into the deeper level of the Premium Zone captures high-side liquidity (with a notable reaction at the FVG on the left), forming a secondary 30m IBDR. After this liquidity sweep, the remaining liquidity is on the low side. Price then reverses downward toward it. Here, the 30m IBDR would suggest a confirmation for a potential sell entry by targeting the IBDR lows.
The relationship between the broader 1h IBDR, the more detailed 30m IBDR, and all related levels creates a powerful analytical framework. The larger timeframe provides context, while the smaller one reveals specific trading opportunities by providing entry confirmations.
✨ SETTINGS
- IBDR Metrics: Adjust the timeframe and sensitivity for calculating the IBDR so traders can adapt the indicator to both short-term intraday movements and longer-term trends.
- Premium/Discount Zones: Customize the levels such as 0, 0.5, 1, and other levels like 0.25 and 0.75 by default and their displayed colors and associated labels.
- Alerts: Configure the alerts for Premium/Discount zones, High/Low breaks, and new IBDR, ensuring traders are kept up to date on key market events.
🎯 CONCLUSION
The Market Environment indicator serves as a powerful tool for analyzing and navigating market structure through liquidity zones. It helps identify optimal buy and sell areas while aligning with the institutional logic of major market players.While its features provide a valuable edge, it’s essential to remember that none should be used on its own, and many more factors go into being a profitable trader.
🔄 UPDATES
Jan 31
Release Notes
- New Levels Added: Expanded the number of price levels available, giving traders more flexibility.
- Option Update: Replaced the “Block PD Arrays” setting with a new “Direction” option, allowing users to control the IBDR display mode (Market, Up, Down), for improved customization.
- Tweak: Minor optimizations to ensure optimal efficiency.
Mar 6
Release Notes
- Bug Fix: Corrected an issue where the timeframe labels could sometimes display incorrect values.
- Minor Changes